 ATLAS
ATLAS 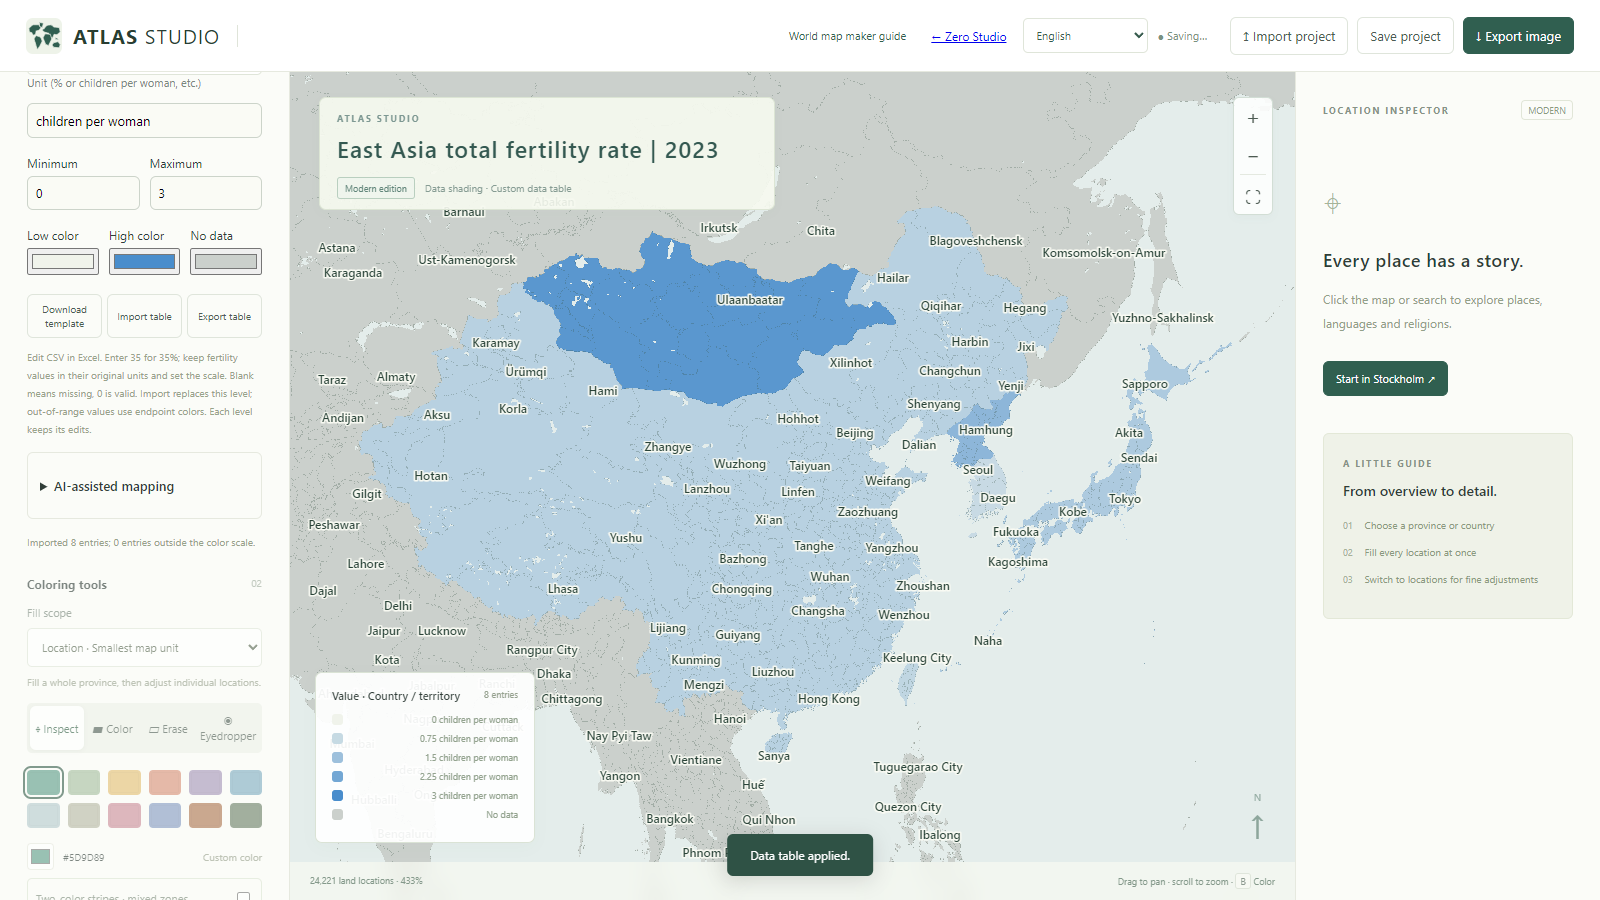
Use two reusable prompts, traceable 2023 fertility data and a ready-to-import CSV to make an East Asia data map.
Download the importable CSV: 8 rows with sources · Download the source snapshot JSON
Define the indicator first
Total fertility rate summarizes a hypothetical cohort using the age-specific fertility rates of one year. It is not the number of births per thousand residents and does not predict how many children an individual woman will have. This reproducible example deliberately fixes the year at 2023; it is not a latest-data comparison.
The example covers China, Japan, South Korea, North Korea, Mongolia, Taiwan, Hong Kong and Macao using Atlas country/region keys. Geographic labels serve data matching. These are area-wide figures, not measured rates for every province, town or small map polygon.
Prompt 1: find verifiable data
Find total fertility rate for 2023, in children per woman, for CN, JP, KR, KP, MN, TW, HK and MO.
Prefer World Bank indicator SP.DYN.TFRT.IN, the UN or national statistical offices. For Taiwan, use Ministry of the Interior data; if the original unit is per mille, retain that value and explain division by 1000.
Return an audit table with area, year, original value and unit, converted value, exact source URL, publisher, estimate versus registered statistic, retrieval date and unresolved issues. Leave unverified values blank.
Use the same year and indicator. Do not substitute crude birth rate or population growth. Explain methodological differences. If you cannot browse, say so and only organize the sources I provide.
A defined indicator, year and source requirement make the output easier to check than a vague request for birth rates. Open the cited page and inspect its table: a plausible URL alone is not verification. A model without browsing can transform supplied data, but should not claim to have checked current statistics.
Check the 2023 East Asia example
| Area | Atlas key | 2023 value | Data source |
|---|---|---|---|
| China | CN | 0.999 | World Bank WDI |
| Hong Kong | HK | 0.751 | World Bank WDI |
| Japan | JP | 1.2 | World Bank WDI |
| North Korea | KP | 1.78 | World Bank WDI |
| South Korea | KR | 0.721 | World Bank WDI |
| Mongolia | MN | 2.7 | World Bank WDI |
| Macao | MO | 0.586 | World Bank WDI |
| Taiwan | TW | 0.865 | Taiwan MOI |
The World Bank API snapshot returned seven observations for 2023. Taiwan comes from Ministry of the Interior data reproduced by Gender Indicators in Taiwan: 865 per mille / 1000 = 0.865. The World Bank series draws on UN and national statistics and may contain estimates; Taiwan uses administrative statistics. This demonstrates traceable data preparation, not identical measurement methods. Retaining source precision does not make the observations equally precise.
Prompt 2: produce Atlas CSV
Convert my verified observations into a UTF-8 CSV for Atlas Studio.
Columns: key,name,value,color,year,unit,source_url,source_note.
Keep keys from the downloaded template. This example uses CN, JP, KR, KP, MN, TW, HK, MO only. The name is a label, not the matching key. value must be a plain number; year must be 2023 and unit children per woman. Leave color blank.
Retain exact source URLs and conversion notes. Quote fields containing commas. Leave unavailable values blank, never zero. Do not treat Taiwan's original 865 per mille as 865 children; do not divide the converted 0.865 again.
Do not manufacture provincial rates from national data. Return one CSV block, not a Markdown table. Check duplicate keys, column counts, sources, years and units before responding.
For another subject, select the correct table level in Atlas and download its template first. At country level, uniquely matched ISO3 codes such as CHN and JPN are also accepted. State, province and location keys must come from the template, not guessed names. Atlas uses key/value/color for rendering; keep the original CSV and source snapshot separately because a later Atlas table export does not retain extra year or source columns.
Paste the CSV into your map
- Open the East Asia data-map link below. It changes the initial view and layer only; it does not automatically import or overwrite numbers.
- Select the country/region table level, set the unit to children per woman, use minimum 0 and maximum 3, and choose a single sequential color scale.
- Expand AI-assisted mapping, enter Total fertility rate, year 2023 and scope CN,JP,KR,KP,MN,TW,HK,MO, then use Copy AI prompt. It includes your current settings and a complete allowed-key template. Alternatively use this page’s two prompts and supplied dataset.
- Paste the AI CSV into the input, or download the case CSV and use Import table. A single csv code fence is accepted. Remove explanatory prose around the CSV first.
- Verify sources, year and units, then choose Checked: apply CSV. Applying replaces the current level’s values. Invalid input is rejected before existing data changes.
- Confirm 8 imported observations and 0 outside the scale. Check CN=0.999, JP=1.2 and TW=0.865 in the table or inspector. All areas outside this dataset should remain missing.
Check the scale and export
Use a title such as East Asia total fertility rate | 2023 | children per woman. Keep the same 0–3 scale for comparison. Gray means this example provides no observation, not zero. The scale is a display choice, not a theoretical maximum. Zoom in to inspect small areas such as Hong Kong and Macao; also use the data table when their polygons are hard to see.
When exporting a PNG, include the year, data sources and methodological differences in the surrounding caption or report. Save the editable project as JSON, and retain the original source CSV and snapshot separately. Changing the scale changes visual contrast, not the indicator or its definition.
Common problems and fixes
Can I paste a Markdown table?
No. Use the conversion prompt to obtain real CSV. A single CSV code fence is accepted.
Can missing values be zero?
No. Blank means unavailable; zero is a real measured value. Leave an area blank if same-year data cannot be verified.
Why do imported values look almost identical?
Check whether the settings are still percent and 0–100. This case needs children per woman and 0–3. Do not multiply 1.2 by 100.
Can AI make a province-level fertility map?
It can help locate data, but you need actual province-level observations with a shared year and definition, plus the matching province template. National values are not provincial measurements.
Sources and future updates
The snapshot preserves the retrieval date, World Bank response and Taiwan unit conversion. To update the map, research every area for the new year and revise the title. Do not update only a few rows or mix AI guesses with verified observations.
- World Bank: total fertility rate, SP.DYN.TFRT.IN
- Taiwan original values and per-mille unit
- Ministry of the Interior Statistical Yearbook: fertility rates
World Bank WDI: SP.DYN.TFRT.IN · CC BY 4.0 · retrieved 2026-10-12.
Give your observations a clear map.
Start small, check your categories, keep an editable backup, then share your result.
Return to the map workspace