Define which cultural information you are mapping
Culture is a broad subject. Choose a specific, verifiable theme, such as “Local language distribution in Jiangnan,” “Regional food traditions” or “My classification of cultural areas.” Free coloring can support these themes when you explain the criteria.
Language is one way to explore culture, but speakers of a language need not share an ethnicity or cultural identity. The built-in Languages layer illustrates local classifications and coexistence. A color cannot establish residents’ ethnicity or substitute for a person-level mother-tongue survey.
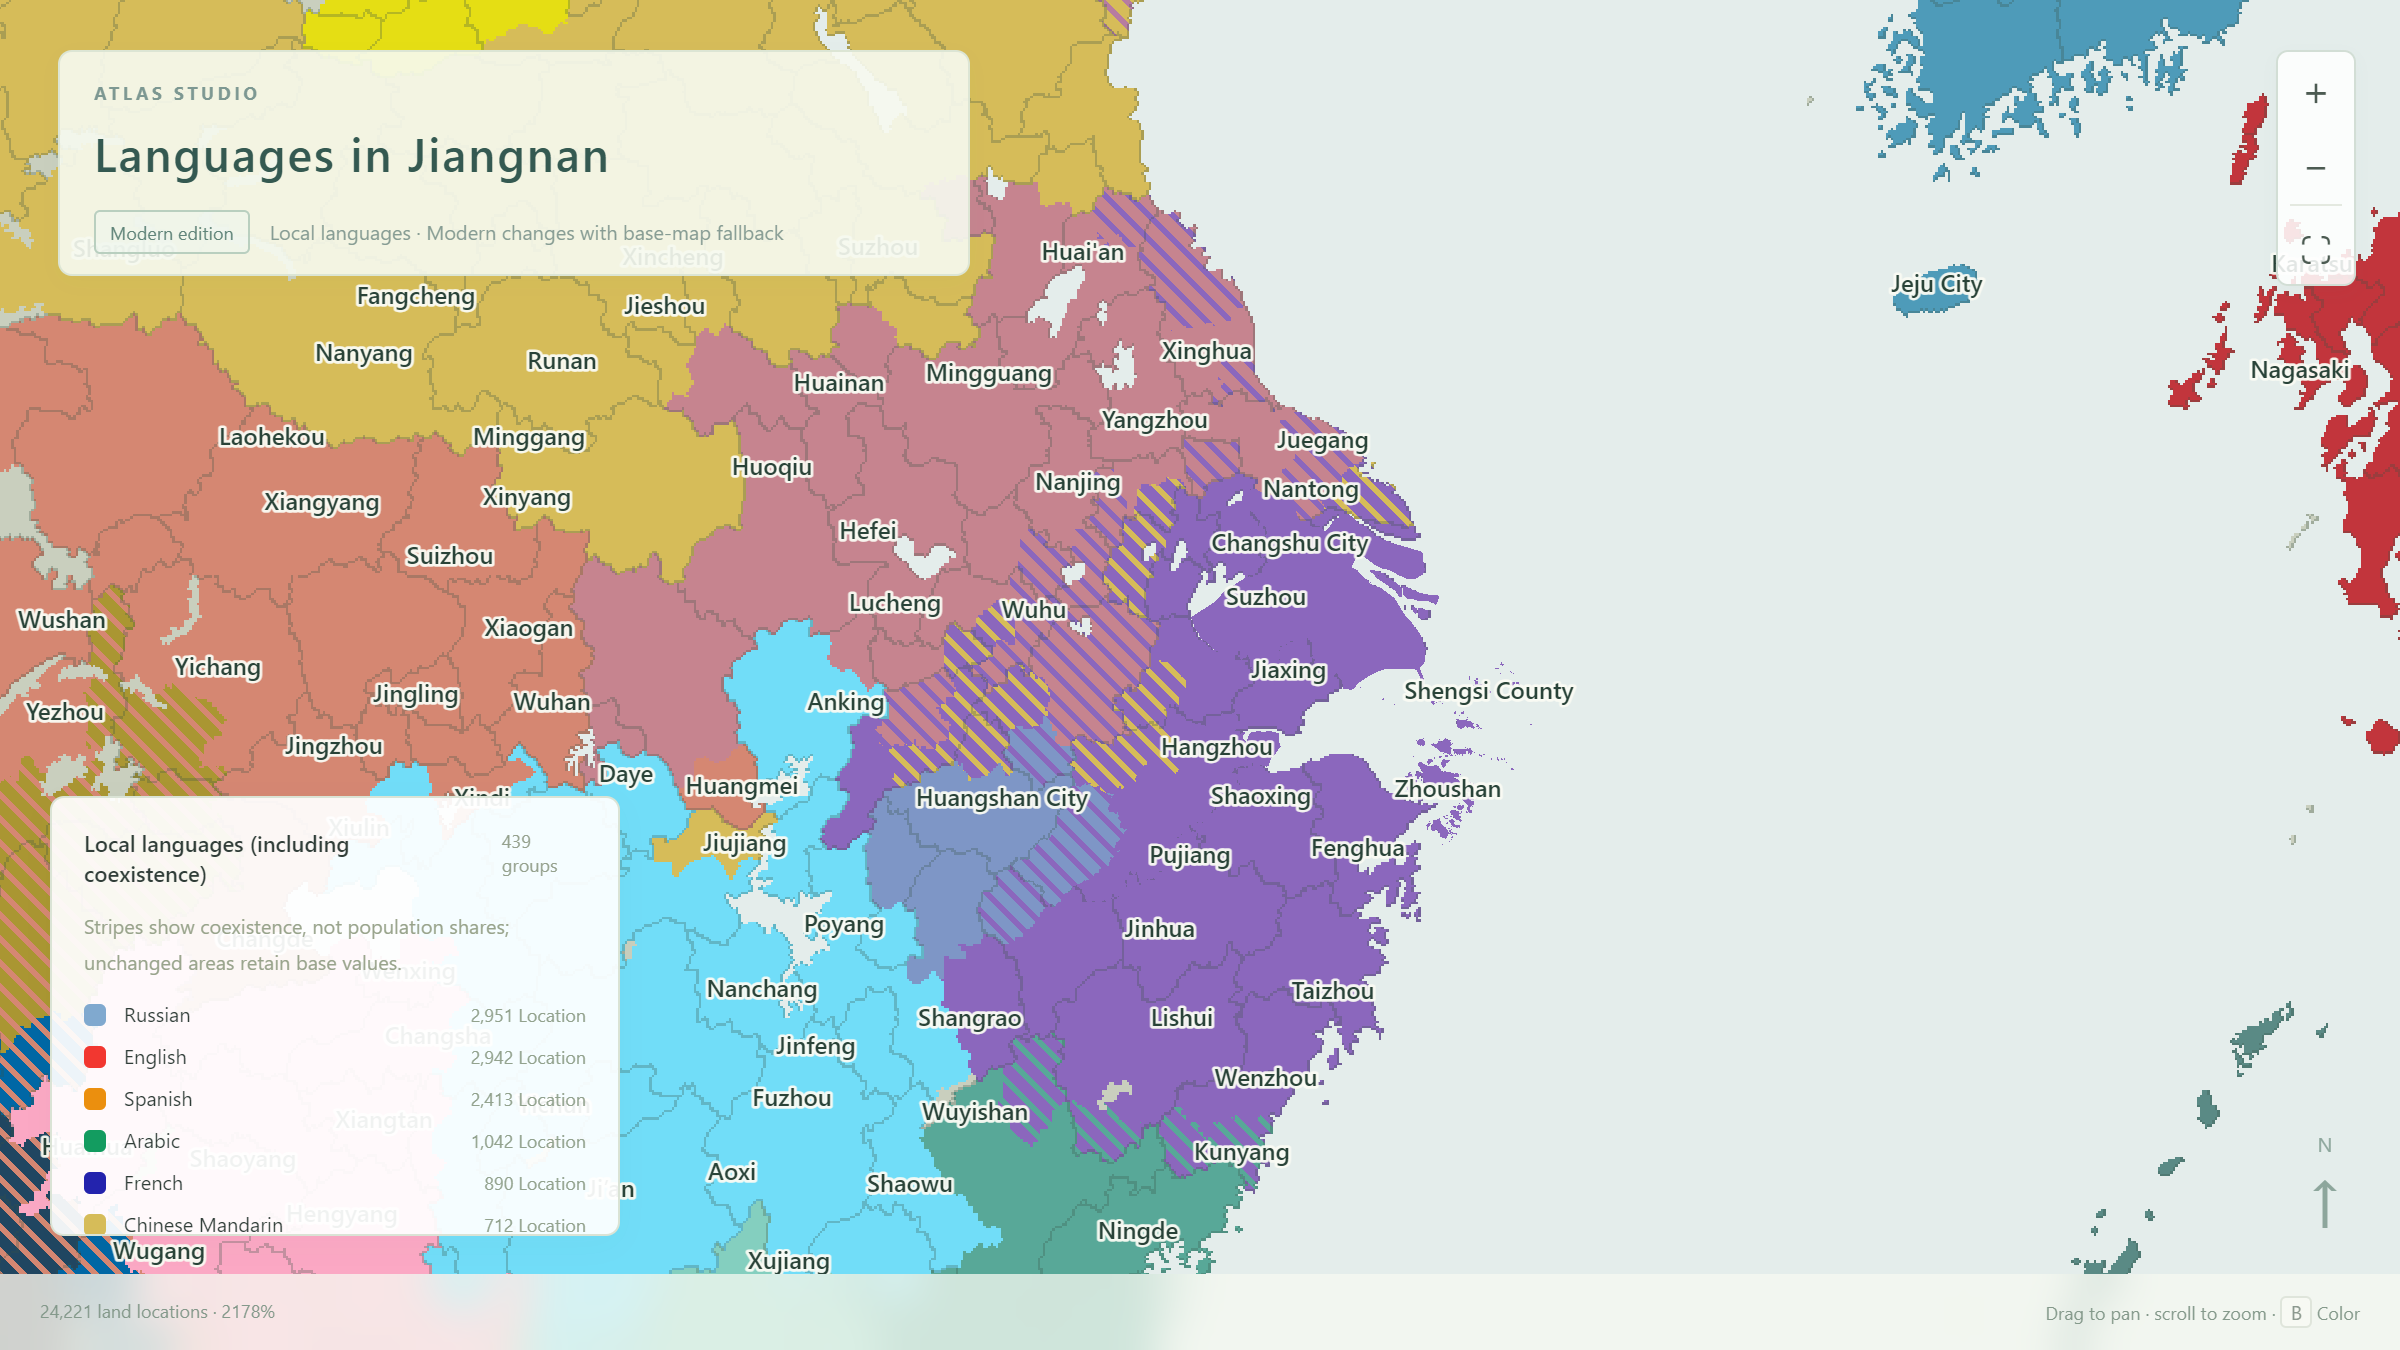
Open the Jiangnan language exampleInspect locations to distinguish base colors and coexistence
- Select Languages and search for Shanghai, Suzhou or Hangzhou.
- Inspect a location and read its name and province/region assignments.
- Read the language composition field and look for a second language.
- Focus a legend category, then click it again to clear the focus. Compare its continuity or scattered presence across neighboring locations.
- Use location borders for detail and province or region borders for the broad pattern.
A cell’s base color and stripes represent two classifications. Where modern local percentages are unavailable, the cell shows classification and coexistence only. Legend counts refer to cells, not speakers.
The interface supports eight languages. Changing it updates buttons and available translated names; it does not change the actual language categories represented on the map.
A Jiangnan exercise: core areas and mixed edges
In this site’s Jiangnan sample, the surroundings of Shanghai, Suzhou and Hangzhou offer starting points for exploring the Ngyoq (Wu) category. Zoom in and follow neighboring cells through solid areas and striped edges. The exercise demonstrates how the map expresses coexistence between local and wider-use languages.
Focus the Wu category to identify its continuous core, then clear the focus and inspect surrounding classifications. Moving toward Nanjing, southern Anhui or the north bank of the Yangtze, practice finding striped locations and checking their province and region assignments. Sharing a region name does not require all constituent locations to have one language.
Where a mapped location includes different settlements, stripes can retain a mixed classification. Neither solid colors nor stripes mean every village has been verified individually. Geometric detail does not establish survey detail.
| Observation | Useful description | Needs further data |
|---|---|---|
| A continuous base color | The sample assigns these locations to one local language category. | What is the actual share of users in each place? |
| Two-color stripes | The location marks the presence of another language. | Are the two shares equal? |
| Scattered small patches | The map retains a local language’s regional presence. | Do these represent concentrated settlements, urban migration or approximate assignments? |
These descriptions explain the spatial pattern while distinguishing map classifications from questions that need local evidence.
Show common and local languages together
One place can use a national common language, a regional lingua franca and a traditional local language. A single color cannot express every part of that situation. Two-color stripes keep a second category visible.
Some local-language areas of France, Ireland and other locations in this site’s sample provide another exercise: common and local language markings coexist. These coarse cells express presence, rather than whether a language remains the main daily language or how widely it is used. Those questions require local data.
Apply the same distinction in multilingual regions such as Xinjiang. Inspect locations around Kashgar and Aksu, then around Urumqi. Read the current classifications and decide whether your subject is local geographic distribution or everyday-use percentages. If you deliberately place the local language in the base color of a custom map, state that rule in the legend; readers should not assume the base color always means the largest population group.
Two-color patterns have a limit
Free coloring currently combines two colors. To discuss three or more languages, narrow the subject, create several maps with the same framing, or add explanatory text. Two stripes cannot represent every language identity and situation.
Make a culture or language map
- Choose a clear theme. For example, “Local and common language coexistence.” Keep language, ethnicity and food classifications distinct.
- Define a consistent legend. Give two or three categories their colors and names. Use the same category colors in striped mixtures.
- Paint broad areas. Establish a province or region base as a draft of a continuous language area.
- Check local details. Return to Location and adjust transitions and exceptions using local information.
- Add coexistence. Enable two colors where another category should remain visible.
- Complete the title. Use a description such as “Local and common language coexistence in [area]” and explain your base-color rule in the legend.
- Back up and share. Save JSON for editing and PNG for articles or lessons.
The Eyedropper helps match your custom colors to inspected classifications. Check the legend when different categories have similar colors so you do not accidentally merge them. Neighboring categories and striped pairs should remain distinguishable.
Province and region groupings make editing faster. Language boundaries do not necessarily follow administrative borders, so broad coloring establishes a draft and individual locations handle boundaries and exceptions.
Read the eyedropper and two-color instructions →Map language-use percentages when you have them
With one survey’s “daily use of a language” percentages, create a numerical map. Mother tongue, home use, comprehension, conversational ability and second-language ability are different indicators, even when all are expressed as percentages.
- Use a consistent indicator, year and geographic scale across areas.
- Choose the matching table level and download a CSV template.
- Set % as the unit and limits of 0–100. Enter 35 for 35%.
- Leave places without matching data blank, retaining the missing-data color.
- Use the same scale for a language and state the actual indicator, such as home use or conversational ability, in the title.
Multilingual people can use several languages, so language-use percentages need not exclude each other. Do not subtract another language simply to force a 100% total, or distribute a provincial percentage uniformly to all its locations.
Use classifications and stripes to show that a region retains a local language. Use numerical coloring to compare its use percentages. The title and legend explain which question you are answering.
Give your observations a clear map.
Start small, check your categories, keep an editable backup, then share your result.
Return to the map workspace